2ab8a8402d961dae915b736c9f6395a7c045e185
Tasmota Power Exporter
A custom exporter for Prometheus for the Tasmota open source smart plug firmware.
Allows you to collect metrics directly from individual smart plugs without the use of HomeAssistant or something similar.
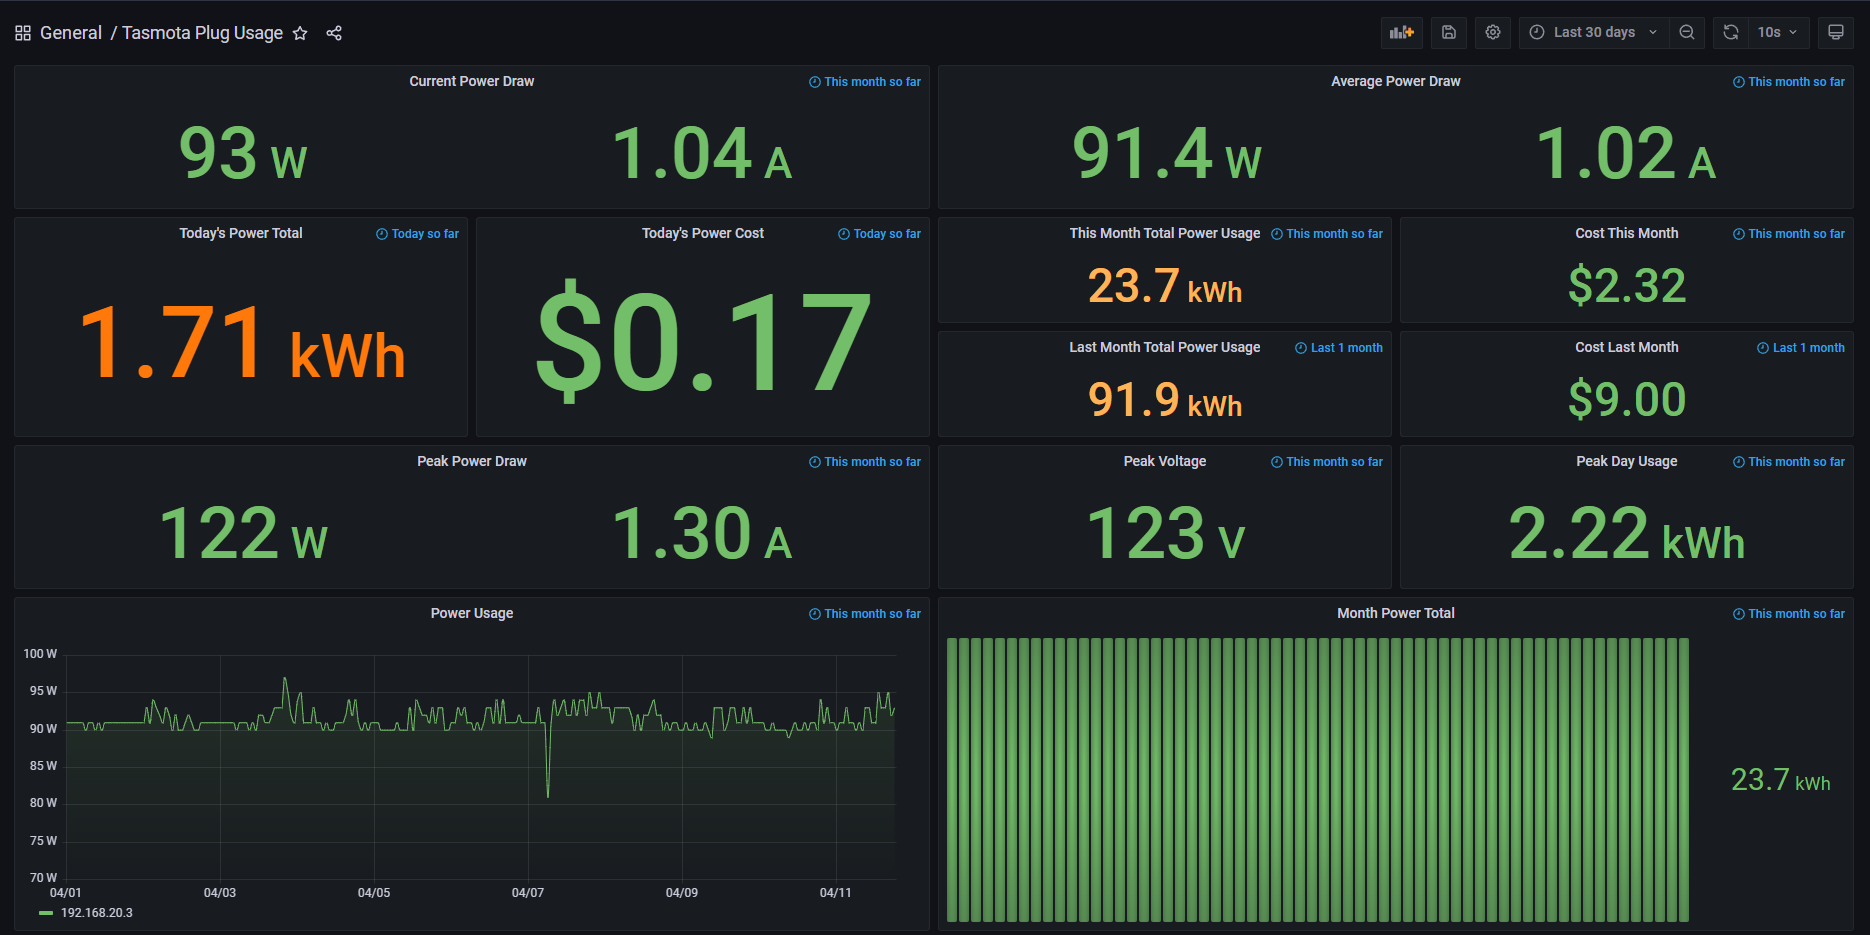
Grafana Dashboard
Available in grafana.json
Deployment
The GitHub actions pipeline automatically builds Docker images for ARM and x86 devices for simplified deployment.
Docker-Compose:
  tasmota:
    image: ghcr.io/astr0n8t/tasmota-power-exporter:latest
    container_name: tasmota-power
    restart: always
    ports:
    - 8000:8000
    environment:
    - DEVICE_IP=<Tasmota IP>
    - USER=<user>
    - PASSWORD=<password>
Prometheus Config:
- job_name: "tasmota"

    # metrics_path defaults to '/metrics'
    # scheme defaults to 'http'.

    static_configs:
        - targets: ["127.0.0.1:8000"]
Development
Perform the following:
git clone https://github.com/astr0n8t/tasmota-power-exporter.git
cd tasmota-power-exporter
pip install -r requirements.txt
All of the exporter code is found in metrics.py.
Contributors
Description
Languages
Python
90.4%
Dockerfile
9.6%
